
Forecasting
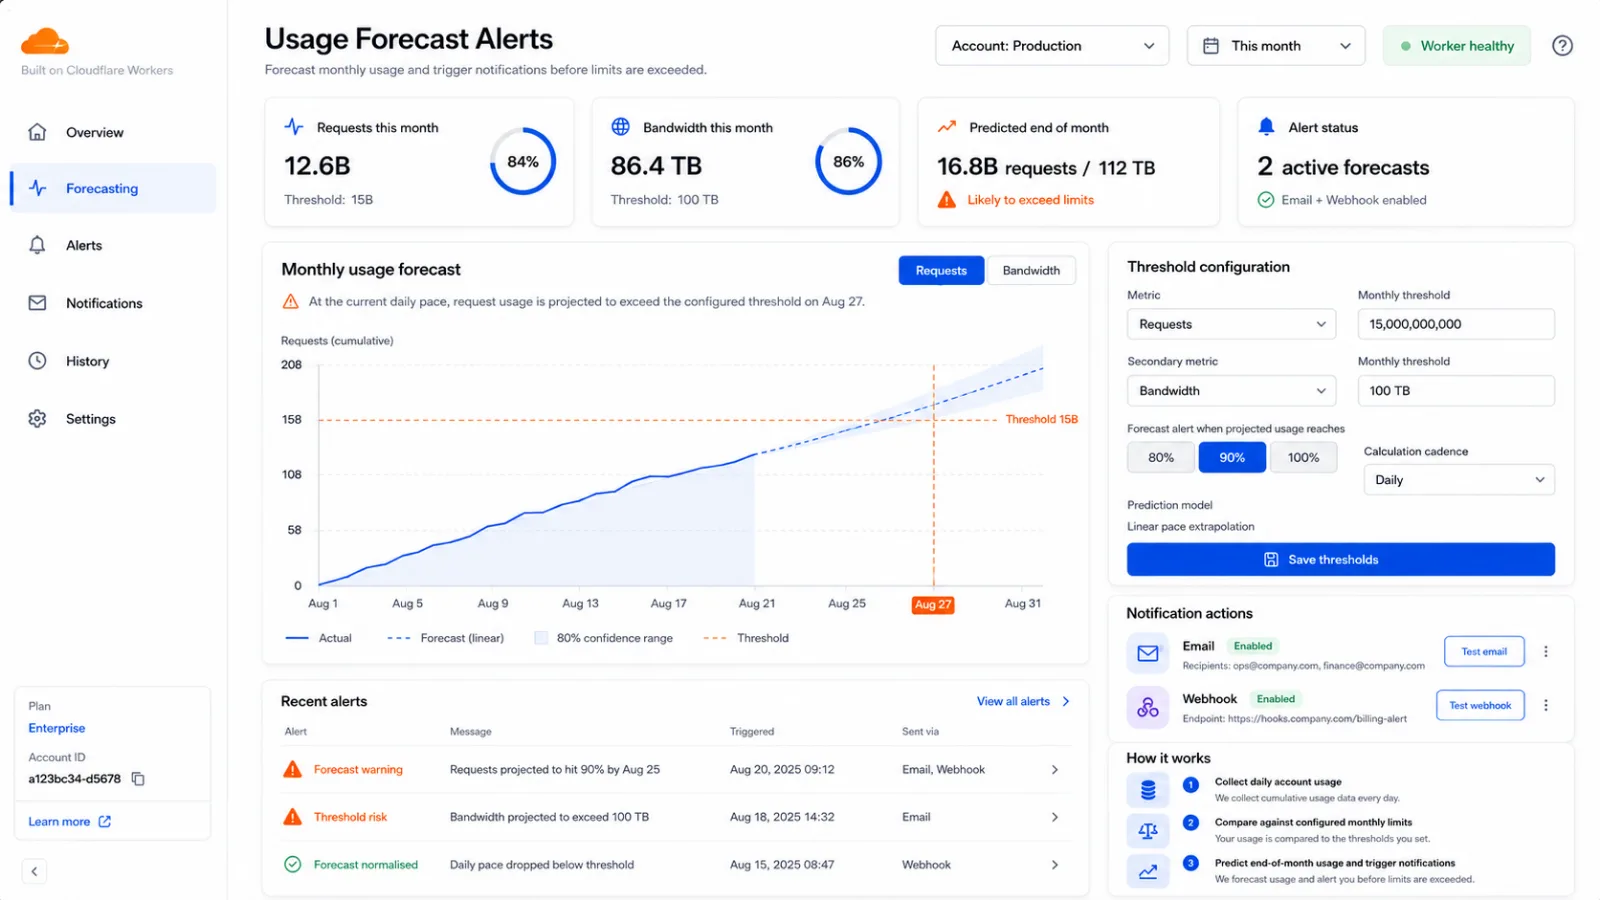
Estimated spend to date and a projection for the period end, per account and per service — so budget conversations happen before the invoice, not after it.
Forecasting, Biggest Spenders and Platform Usage & Custom Alerts for your Cloudflare account — deployed into your own account, so your usage data never leaves it.
A Cloudflare usage and cost dashboard with forecasting, biggest-spenders analysis and custom alerts — deployed into your own Cloudflare account, reading usage with your own credential, so your data never leaves your account. Early access. Instances are provisioned together with our team today; the self-serve OAuth control plane is in development. If you want spend visibility on your Cloudflare estate, we can stand an instance up with you.
Machine-readable context: /ai-index.json
Cloudflare usage grows quietly — a new path here, a traffic shift there — until the invoice explains it the hard way. The Usage & Cost Dashboard makes spend visible while you can still act on it: what today costs, what the period will cost at the current rate, and which paths and hostnames are driving the change.
The distribution model is the point: the dashboard is provisioned into your own Cloudflare account and reads usage with your own credential. Nothing streams to a vendor — the Worker, the database and the numbers all live where the usage does.
Built on
Availability
Early access. Instances are provisioned together with our team today; the self-serve OAuth control plane is in development. If you want spend visibility on your Cloudflare estate, we can stand an instance up with you.
How it works
The control plane provisions the stack and steps out of the data path. Ingestion is idempotent, date keys are UTC, and the Cloudflare API budget is respected with a single paced client — the dashboard never competes with your own console use.
Estimated spend to date and a projection for the period end, per account and per service — so budget conversations happen before the invoice, not after it.
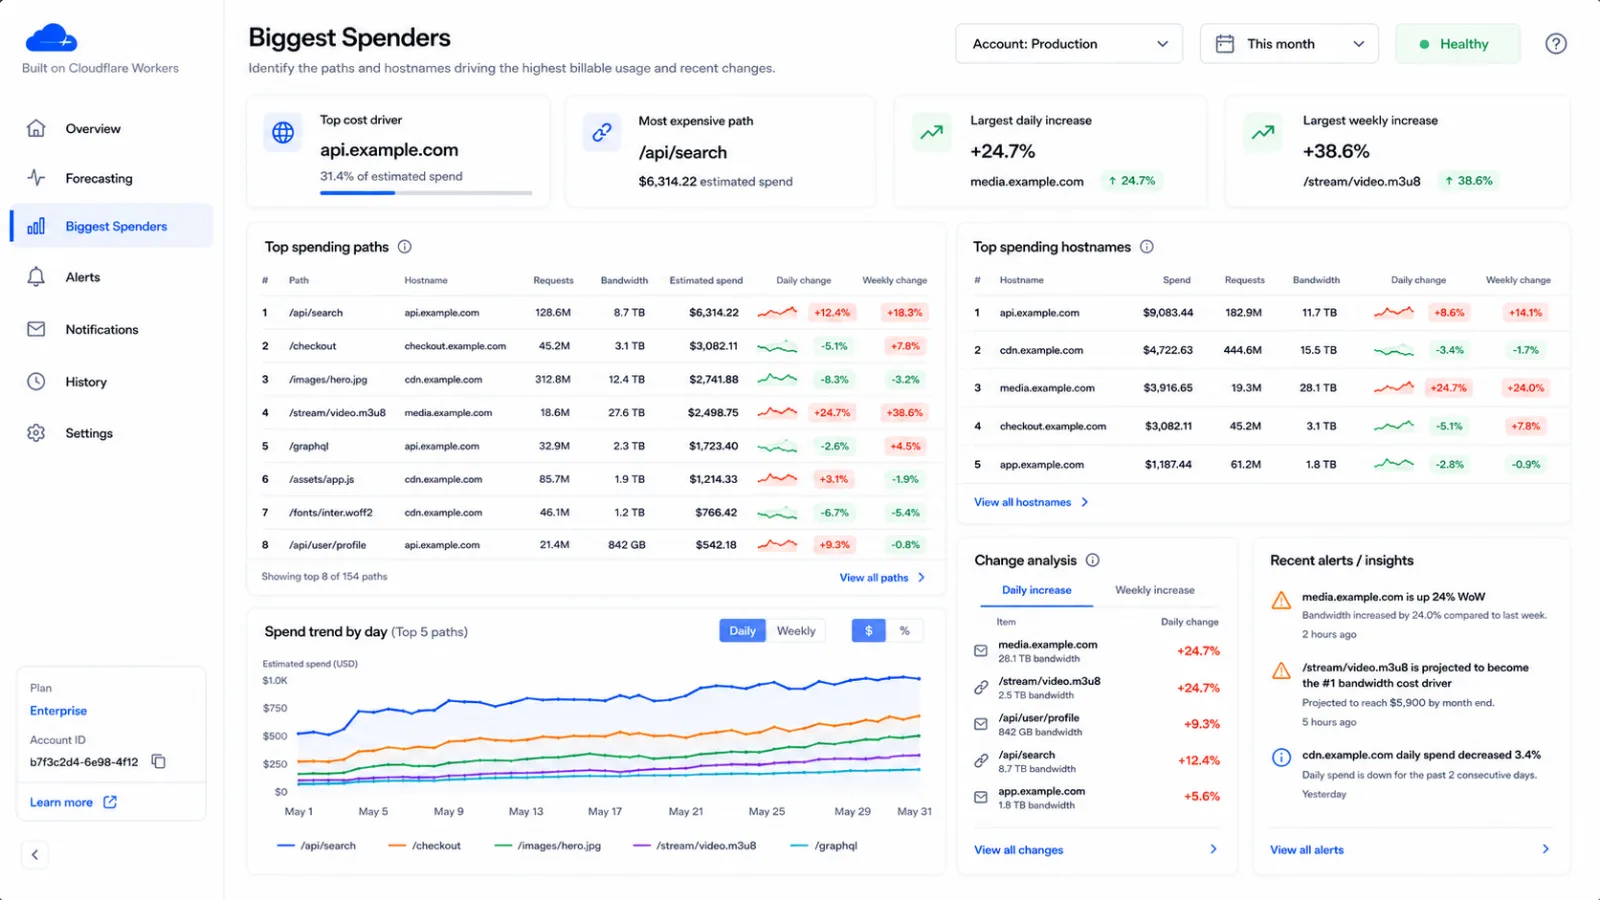
The paths and hostnames driving the highest billable usage, with daily and weekly change analysis — the “what changed?” view for sudden growth.
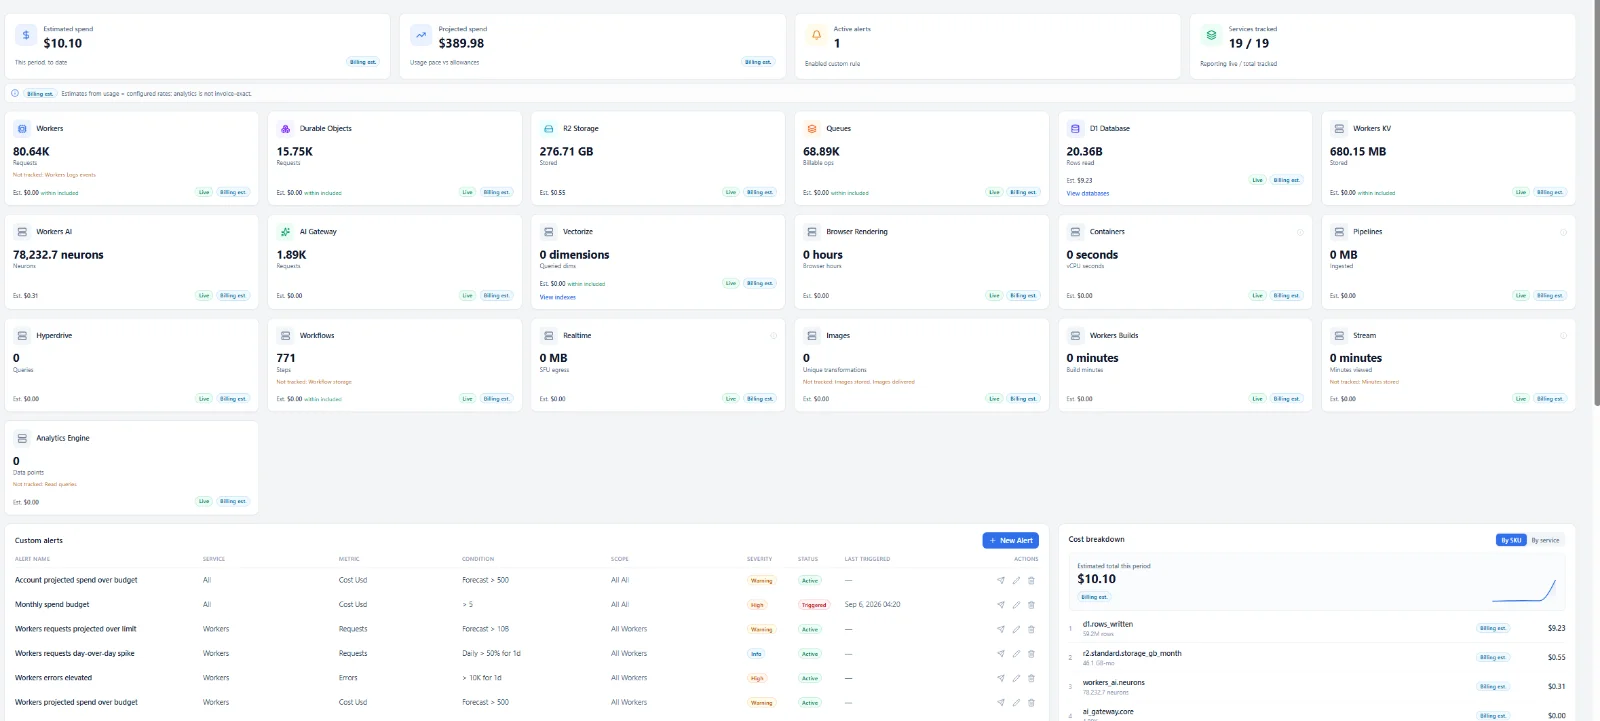
Usage, limits, health and changes across Cloudflare services, with custom alert rules delivered by email through a queue-driven pipeline that tolerates retries.
Every dollar figure carries its provenance — billing metric, billing estimate, analytics-derived or instrumented. Analytics is never presented as invoice-exact.
Daily and weekly movers, projected cost-driver flips and spend-trend charts per path — the dashboard surfaces the anomaly, not just the total.
One Cloudflare client with a token bucket, paced well under the shared API budget — it never competes with your own dashboard use.
The guarantees
The dashboard Worker, its database and every usage row live in your Cloudflare account. Nothing is copied out.
Usage is read with a credential you issue and can revoke at any time.
Figures derived from analytics are labeled as estimates — the dashboard never dresses an estimate up as billing truth.
Walkthroughs run on real data — yours. Tell us what you’re running and we’ll show you what Cloudflare Usage & Cost Dashboard finds.
Whether you're migrating, hardening, or operating Cloudflare — Nanosek brings authorized MSP & ASDP delivery, rollback-ready cutovers, and managed operations after launch.