
1. What Is the Best Way to Analyse Cloudflare Logs in Real-Time?
In a production environment, logs are rarely optional. They're the heartbeat of your traffic, the forensic record of every request and rule decision. For teams using Cloudflare, visibility into this layer becomes essential the moment something goes wrong or starts behaving unexpectedly.
Historically, teams lacked a built-in, native way to inspect Cloudflare traffic logs on demand. Log-level data, while technically available, was often fragmented, delayed or hidden behind external systems. This created critical visibility gaps during security incidents, performance regressions or debugging workflows. The reliance on external storage, manual ingestion and custom dashboards led to slow resolution times, operational overhead and costly infrastructure dependencies. These methods work, but they come with notable cost, delay and operational friction.
The introduction of Cloudflare Log Explorer changes this paradigm. Instead of building infrastructure to analyse your traffic, Cloudflare now allows you to query it directly, natively and in near real-time.
2. What Are the Current Methods for Accessing Cloudflare Logs, and How Do They Compare?
Prior to Log Explorer, two primary methods existed:
A. Logpush
This mechanism streams log data to a destination such as Amazon S3, Google Cloud Storage or BigQuery. From there, logs can be ingested into SIEMs like Splunk or analytics tools like Datadog and Snowflake.
Advantage | Trade-off |
Full control over storage and tooling | Requires infrastructure and maintenance |
Long-term retention | Visibility delayed by minutes |
Supports dashboards and alerts | Needs scripting and ingestion pipelines |
B. Logpull API
Available to Pro, Business and Enterprise plans, this is a programmatic method for retrieving recent log data.
Advantage | Trade-off |
No need for external storage | Rate limits and manual effort |
Works without SIEM | No user interface |
Useful for short-term debugging | No long-term retention |
Both methods serve well-defined use cases, but neither is optimal for interactive, exploratory analysis.
Log Explorer fills that gap, offering an alternative for teams who need instant answers without leaving the Cloudflare ecosystem.
3. What Can You Do with Cloudflare Log Explorer, and Is It the Right Tool for You?
Cloudflare Log Explorer provides an embedded, zero-config interface for examining log-level data across multiple Cloudflare services. Unlike external tools that require setup, connectors and custom pipelines, Log Explorer is built directly into the dashboard. Queries can be performed visually or programmatically without delay or infrastructure burden.
This tool is particularly useful if your team needs to:
Investigate incidents quickly without waiting for external ingestion or dashboard updates
Validate edge behavior across services like WAF, Workers and Gateway
Correlate spikes in traffic, latency or errors to specific user agents, locations or rules
Reduce the complexity of debugging production issues without relying on third-party observability tools
Whether you're a platform engineer, security analyst or developer, Log Explorer gives you operational clarity right at the edge.
4. When Should You Choose Log Explorer Instead of Logpush for Cloudflare Logs?
This is one of the most common questions teams ask. The answer depends on the stage you're at and the type of visibility you need.
Scenario | Best Fit |
No SIEM or external observability pipeline | Log Explorer |
Need to investigate incidents as they happen | Log Explorer |
Require long-term retention and compliance storage | Logpush + SIEM |
Need alerting or correlation across multiple systems | Logpush + SIEM |
Want to minimise operational overhead | Log Explorer |
In many cases, organisations choose to combine both tools, using Log Explorer for quick, ad-hoc triage and Logpush for deeper historical analysis and compliance.
5. How Does Cloudflare Log Explorer Work and What Datasets Can You Query?
At its core, Log Explorer gives you access to raw datasets from Cloudflare products without needing to build any backend infrastructure.
Supported datasets include:
HTTP request logs
Firewall (WAF) events
Bot Management signals
Workers traces
Zero Trust Gateway activity
Load Balancer request paths
The interface allows filtering by IP, user agent, path, status code, country, colo and more. You can run precise queries with natural scoping, either via UI or API.
Example use case: A spike in 403 errors. Instead of exporting logs to S3, you can run a real-time query filtered by path and user agent to isolate the cause.
6. What Are Practical Use Cases for Cloudflare Log Explorer?
Can Log Explorer Be Used Without a SIEM?
Yes. Log Explorer is purpose-built for organisations that don’t yet have a SIEM or do not wish to maintain ingestion pipelines and external storage. It provides real-time access to critical traffic and security logs without exporting data, enabling:
Incident analysis within seconds
Validation of WAF and Zero Trust policies
Operational troubleshooting without a third-party dashboard
This makes it highly effective in environments where agility, speed and native visibility are paramount.
Some of the most effective applications we've seen:
Investigating a traffic anomaly – Track down the root cause of unexpected traffic bursts or request types.
Tuning WAF or Bot Management rules – Identify patterns that trigger false positives or missed threats.
Debugging performance issues – Find latency across regions or origins and trace problematic endpoints.
Zero Trust validation – Observe enforcement decisions made at the edge.
Visibility without exporting logs – Answer critical questions in seconds, not hours.
These use cases are especially powerful when time-to-resolution matters.
7. What Are the Limitations of Using Cloudflare Log Explorer for Log Analysis?
While Log Explorer is powerful, it’s important to understand its boundaries:
Enterprise Only – Access is limited to Enterprise plan users
Short-Term Use – Designed for investigation, not archival
No Dashboards or Alerts – Not intended for visualisation or correlation workflows
Dataset-Specific – Coverage depends on which Cloudflare products are enabled
Query Cost Considerations – Excessively broad or frequent queries may impact usage quotas
For long-term analytics or multi-source correlation, teams may still prefer to export data using Logpush.
8. What Are the Best Practices for Efficiently Using Cloudflare Log Explorer?
Keep queries scoped and time-bound to avoid unnecessary volume
Use combined filters (e.g. path + IP + status) to narrow results
Incorporate API automation to standardise recurring investigations
Pair with rate limiting insights and firewall analytics for full context
Use Log Explorer to validate mitigation effectiveness during incidents
9. Frequently Asked Questions About Cloudflare Log Explorer
How do I use Cloudflare Log Explorer to analyse WAF events?
Use the firewall events dataset and filter by rule-id, action or other attributes. This helps identify why requests were blocked or challenged.
Can Cloudflare Log Explorer replace a SIEM tool?
For short-term, ad-hoc investigations, yes. But it does not provide long-term retention, alerting or correlation across systems like a SIEM would.
What datasets are available in Cloudflare Log Explorer?
Currently supported: HTTP requests, WAF events, Bot Management logs, Workers traces, Load Balancer decisions and Zero Trust Gateway.
How to query blocked requests in Cloudflare Log Explorer?
Filter HTTP or firewall datasets by status codes (e.g. 403) or actions like block or challenge.
What is the retention period for Cloudflare Log Explorer data?
Retention is short-term and depends on your usage and plan. It is designed for immediate investigation, not archiving.
Is Cloudflare Log Explorer available in all plans?
No. It is available only to customers on Cloudflare's Enterprise plan.
How to use the Log Explorer API in Cloudflare?
You can send structured queries to Cloudflare's RESTful API endpoint to retrieve logs programmatically, similar to the UI experience.
How to troubleshoot bot traffic with Cloudflare Log Explorer?
Query the bot-management dataset or use the HTTP dataset with filters on Bot Score, User Agent or Threat Score.
Can I export Cloudflare logs from Log Explorer?
Yes. You can download results from the UI or extract them via the API for further analysis.
Cloudflare Log Explorer vs Kibana: which is better for real-time analysis?
Log Explorer is faster to set up, requires no infrastructure and provides near-instant insights, while Kibana is more flexible but requires external storage, setup and ingestion pipelines.
10. Why Should Cloudflare Log Explorer Be Part of Your Operational Toolkit?
Log Explorer is more than a log viewer; it is a tool built for speed, focus and practical impact.
If you're already using Cloudflare and need fast answers to operational questions, this is one of the most direct, frictionless ways to get them. With zero integration overhead and deep coverage across services, it becomes a natural extension of your debugging and security toolkit.
Related posts
More from the blog
Nanosek's Cloudflare Environment Audit: For improved performance, security, and cost-effectiveness
Understanding your Cloudflare environment In today's fast-paced digital landscape, businesses heavily rely on technology to operate,...

What Makes Nanosek Your Trusted Managed Service Provider (MSP) For Cloudflare?
Nanosek and Cloudflare have teamed up to provide top-tier applications, zero-trust, and network security services. Combining Nanosek's...
Cloudflare Servers Don't Own IPs Anymore – So How Do They Connect to the Internet?
Cloudflare Servers Don't Own IPs Anymore – So How Do They Connect to the Internet?NanosekDec 4, 202210 min readThis article comes from Cloudflare's official blog. We at Nanosek want to keep our clients informed on any news or updates from the Cloudflare team. For more information- and how you can up
Transitioning from AWS to Cloudflare Developer: Optimizing Costs and Accelerating Performance
Transitioning from AWS to Cloudflare Developer: Optimizing Costs and Accelerating PerformanceIdo Sender6 days ago0 min read66 views00 comments1 like. Post not marked as liked1
קלאודפלייר לסטארטאפים: נאנוסק מביאה את תוכנית Cloudflare for Startups לישראל
גלו איך ניתן לקבל גישה מלאה לתשתית ולפלטפורמת הפיתוח של Cloudflare, עם עד $250,000 בקרדיטים וליווי מקצועי של מומחי Cloudflare ונאנוסק בישראל. סטארטאפים פועלים בסביבה מהירה, מבוזרת ודינמית, שבה מוצרים נדרשים להיבנות במהירות, לשרת משתמשים מכל העולם ולהיות מוכנים לסקייל בכל רגע, לעיתים עם צוות קטן וללא
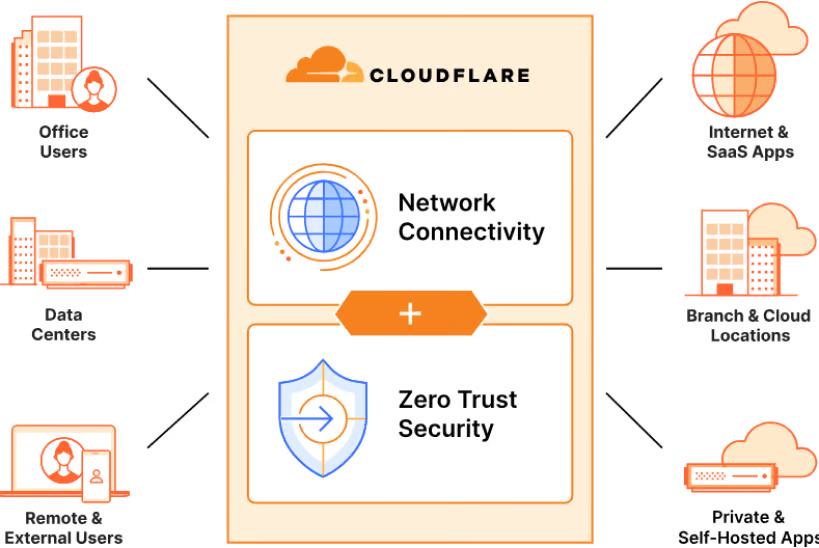
Cloudflare One Explained: A Clear Guide to Cloudflare’s SASE Products
Cloudflare One was previously known as Cloudflare Zero Trust. Today, Cloudflare One represents Cloudflare’s unified Secure Access Service Edge (SASE) platform, combining identity-driven security services with global network connectivity and segmentation inside one distributed system. This evolution